What is happening to Vermont?
As the global climate shifts towards a warmer state, the cold season in Vermont is getting shorter and the warm season longer.
Mid-latitude continental regions have a large annual cycle of temperature with cold (when frost is likely) and warm seasons of comparable length. As illustration, the Figure shows the mean annual cycle of temperature for Rutland, Vermont for the past decade: monthly mean daily minimum temperature, Tmin, monthly mean temperature, T, and monthly mean daily maximum temperature, Tmax. The annual mean temperature is 7.3◦C (45◦F), with summer mean maximum temperatures reaching 26◦C (79◦F) in July and winter mean minimum temperatures falling to -11.3◦C (20◦F) in January. Daily temperature extremes cover a wider range then these monthly means. Killing frosts in spring and fall determine the summer growing season and extreme minimum temperatures in winter determine the survival of some plants and shrubs and overwintering insects. (See Figure .)
The critical climate reference temperature is the freezing point of water: 0◦C (32◦F), shown on Figure. The annual mean temperature is not far above freezing, so an upward mean shift of just 1◦C (1.8◦F) has a significant impact on the Vermont climate by shrinking the length of the cold season and increasing the length of the warm season. A red dashed line at -1 ◦C has been drawn so the impact of this relative shift can be easily visualized. In fact as the global climate warms, winter temperatures over the northern latitude continents have generally been rising faster than summer temperatures (Hansen et al. 2010). The warming of global and regional climate is being driven by the greenhouse effect: as atmospheric CO2 increases, this increases the surface warming by the downward longwave radiation from the atmosphere. This rather small effect is amplified substantially by two positive feedbacks. The increase of water vapor with temperature amplifies the warming in all seasons, because water vapor is also a powerful greenhouse gas. But there is an additional positive feedback in the cold season if snow cover is reduced, because this reduces the strong reflection of sunlight by the snow – this is called the shortwave snow and ice-albedo feedback. These positive feedbacks operate on global scales at northern latitudes and contribute to the melting of the northern polar sea ice (Screen and Simmonds 2010), but they operate on local scales as well. As Vermont’s climate warms, and the temperature shifts upward relative to freezing, this reduces the length and chill of the cold season, which is likely to reduce snow cover and the reflection of solar radiation (so that the surface absorbs more heat). At the same time, evaporation and atmospheric water vapor increase with warmer temperatures, and the water vapor greenhouse effect increases the downward longwave radiation that also heats the surface. A few long-term datasets exist that illustrate how, in recent decades, these processes have affected Vermont’s climate, the frozen duration of its small lakes, the onset of spring and the length of the growing season.
The freeze and ice-out dates for small lakes (called Ponds in Vermont) are good ‘integrated’ climate indicators for the length and severity of the cold season in Vermont. The date of freeze-up depends on lake and air temperatures over many weeks in the fall; ice thickness depends on the severity of the winter, and the date of spring melt/ice-out depends on ice thickness and air temperatures in spring. These dates are important for the ecology of the lakes, and the frozen period (and ice thickness) matter to the public for winter recreation, including ice fishing.
The freeze-up and ice-out dates for Stile’s Pond in Waterford, Vermont have been recorded by an observer for the Fairbanks Museum, St Johnsbury, Vermont since 1971. Figure 2 shows that on average Freeze-up has occurred later by +4 days per decade and Ice-out has got earlier by -3 days per decade. (See Figure .)
Figure 3 how many days Stile’s Pond was frozen each winter since 1971.(See Figure .) The frozen winter period has decreased on average by 7 days per decade. The frozen period in 2010 was especially short and ice-fishing and snowmobiling on frozen lakes was more hazardous in early spring.There is a large variation from year to year (± 11 days), because regional synoptic weather patterns have a large variability, but the trend has been downward for four decades.
The USDA winter hardiness zones depend on the minimum winter temperatures. They are used to tell what plants, shrubs and trees can survive the winter. In the period 1990-2006, the zones marched north as the climate has warmed in winter, so that Vermont has gone from mostly zone 4 to mostly zone 5. (See Figure .)
Read more on Climate Change Indicators
Reference: Betts, A.K. (2011): Vermont Climate Change Indicators. Weather, Climate and Society, 3, 106-115, doi: 10.1175/2011WCAS1096.1
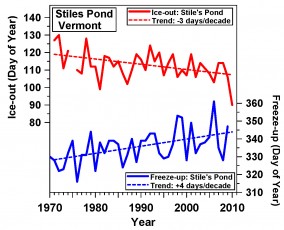 Figure 1: Freeze-up and Ice-out of Stile's PondEvery decade Freeze-up comes later and Ice-out earlier
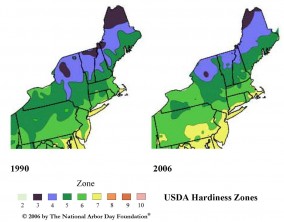 Figure 2: Change of Winter Hardiness ZonesWinter USDA hardiness zones for NE US have changer a lot recently as climate warms
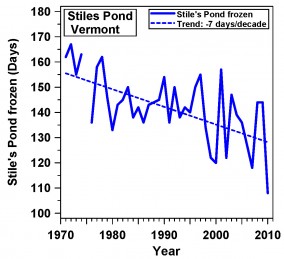 Figure 3: Stile's Pond FrozenWinter frozen period for Stile’s Pond.
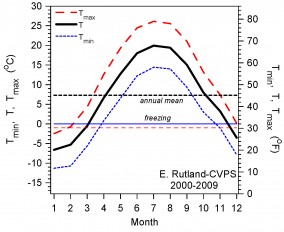 Figure 4: Annual cycle of temperature for Rutland, VermontMonthly mean temperature, mean daily minimum and maximum temperatures, 2000-2009 for E. Rutland (derived from hourly data from Central Vermont Public Service, Rutland


